When we monitor stuff we depend on the monitored device to be at least a bit cooperative. And while most business devices, we are used to, have no issues getting surveilled in one way or another, especially consumer devices tend to be difficult.
In my homelab I have such a device, a German Telekom issued Speedport Smart 3
In part 1 of this blog post we go into detail on how to monitor a Speedport Smart 3 with Nagios and in the upcoming part 2 we build an event handler to automatically react to events like low download speed.
Situation
In germany, ISPs have to provide you with a free modem when you rent an internet connection from them, the free solution for the Telekom is the Speedport. It is a fairly good device delivering most a consumer could wish for. It is not just a simple Layer 2 modem, it is also a router with DHCP, DNS, Wi-Fi, and some smart home capabilities.
But since my home lab covers all these features, I usually put these provider issued devices into modem-mode (or as close to it as possible), and connect it to my firewall which does PPPoE or what ever is needed by the provider to get a connection.
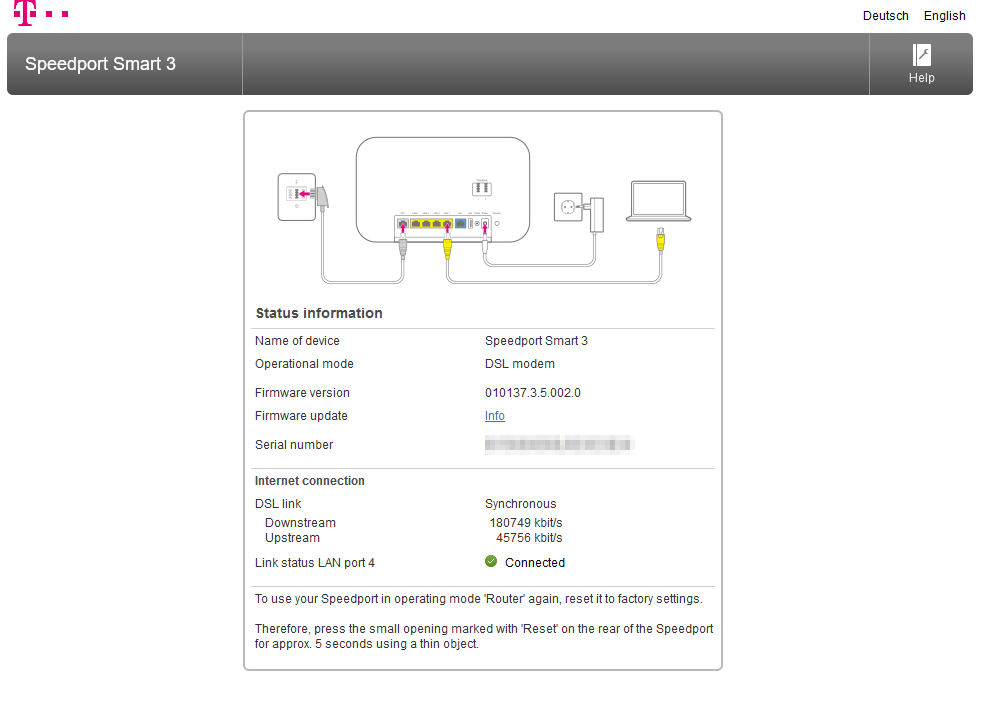
Normally that’s it, the device is dumbed down and does not respond to anything else. But the Speedport Smart 3 has a nice feature that allows one device to connect to either of Port 1-3. When this device assumes an 169.254.2.0/24 IP we can reach the Speedport under 169.254.2.1 and get a nice overview of the reported, theoretical connection speeds and also some meta information about the Speedport.
So I connected port 2 of the Speedport to a free interface of my firewall, gave the interface the appropriate IP and also, since 169.254.0.0 is a Link-local address and normally not routed by network devices, I used the proxy-feature of my firewall to make the Speedport accessible to the rest of my network.
How it works
To monitor the Speedport we have to write a custom nagios check since the data are not easily extracted from the UI the Speedport provides.
For some reason the JSON, the frontend receives from the Speedport, is encrypted. But since the password for it is also found in the frontend code, we can decrypt it but that is not something a standard check, nagios is shipped with, could do. Why it was build like this, with encrypted traffic but decryption keys in user accessible code is not known to me. I suspect an approach of security by obscurity.
Make Speedport service interfaces reachable
before nagios would be able to reach the Speedport’s service interface, we need some network magic done. I have done it two ways in the past. With routers that support routing link-local addresses you could just create a static route for 169.254.2.1 where you set the next hop to the routers interface that is connected to the speedport.
Since this has some security implications als also is not supported by my current firewall, a pfSense, I defaulted to use the integrated HA proxy feature.
Since my pfSense is virtualized, I first created a new virtual interface that terminated to a free physical interface of its host.
The pfSense interface was configured to use 169.254.2.2

I then created a front end and backend in the HA proxy settings to make the speedport reachable to my server vlan, using the pfSense IP and port 8080.
For details on how to create a working proxy configuration for HA proxy, please refer to the pfSense Docs.
Preparing Nagios
First, let us create the Nagios check. I wrote it as a python script, and it can be downloaded from this project’s GitHub repo
Copy check_speedport_connection to /opt/nagios/libexec/
make sure that your nagios host has python3 and all the requirements installed
python3 -m pip install pycryptodome requests
For installing python consult your OS’ manual.
Now we need to teach nagios how to use our new script,
In your commands.cfg, normally located at /opt/nagios/etc add:
1 | define command { |
Note: we could go really over board with defining the check here, but it’s really not necessary and also makes the syntax for using the check in the service config later on way harder.
At last, we need to actually use the check for a service.
I have for each host I monitor one file containing all its service definitions.
1 | ######### HOST DEFINITON |
Now only restarting Nagios is left either using the UI or from terminal.
After some time Nagios should start to show the state like this:

The service check also emits performance data which can be viewed by clicking the little graph symbol next to the service name.
Now You will always know when your internet speed falls below your contract’s limits. Keep in mind that this is the actual reported value from the Speedport that would also be used by Telekom support in case of disputes. By collecting e-mails or even the performance data, you have a nice source of truth.
In Part 2 we will build an event handler that is able to restart the modem using a smart home power plug. Stay tuned.